Highlights of Telecom Subscription Data at the end of May 2026
New · District CollectorCan you hold the district for 72 hours?Floods, a heatwave, an outbreak, a grievance queue. Take the decisions, see the consequences.Play →In this note
UPSC Prelims + Mains Study Note
1. At a Glance
- What it is: Monthly telecom subscription statistics released by the Ministry of Communications via PIB, based on data compiled by TRAI (Telecom Regulatory Authority of India) from all licensed operators. [1]
- Why it matters for UPSC: Tests knowledge of Digital India infrastructure, rural-urban divide, broadband penetration, tele-density benchmarks — core to GS-III (Infrastructure) and GS-II (Government Schemes). [1]
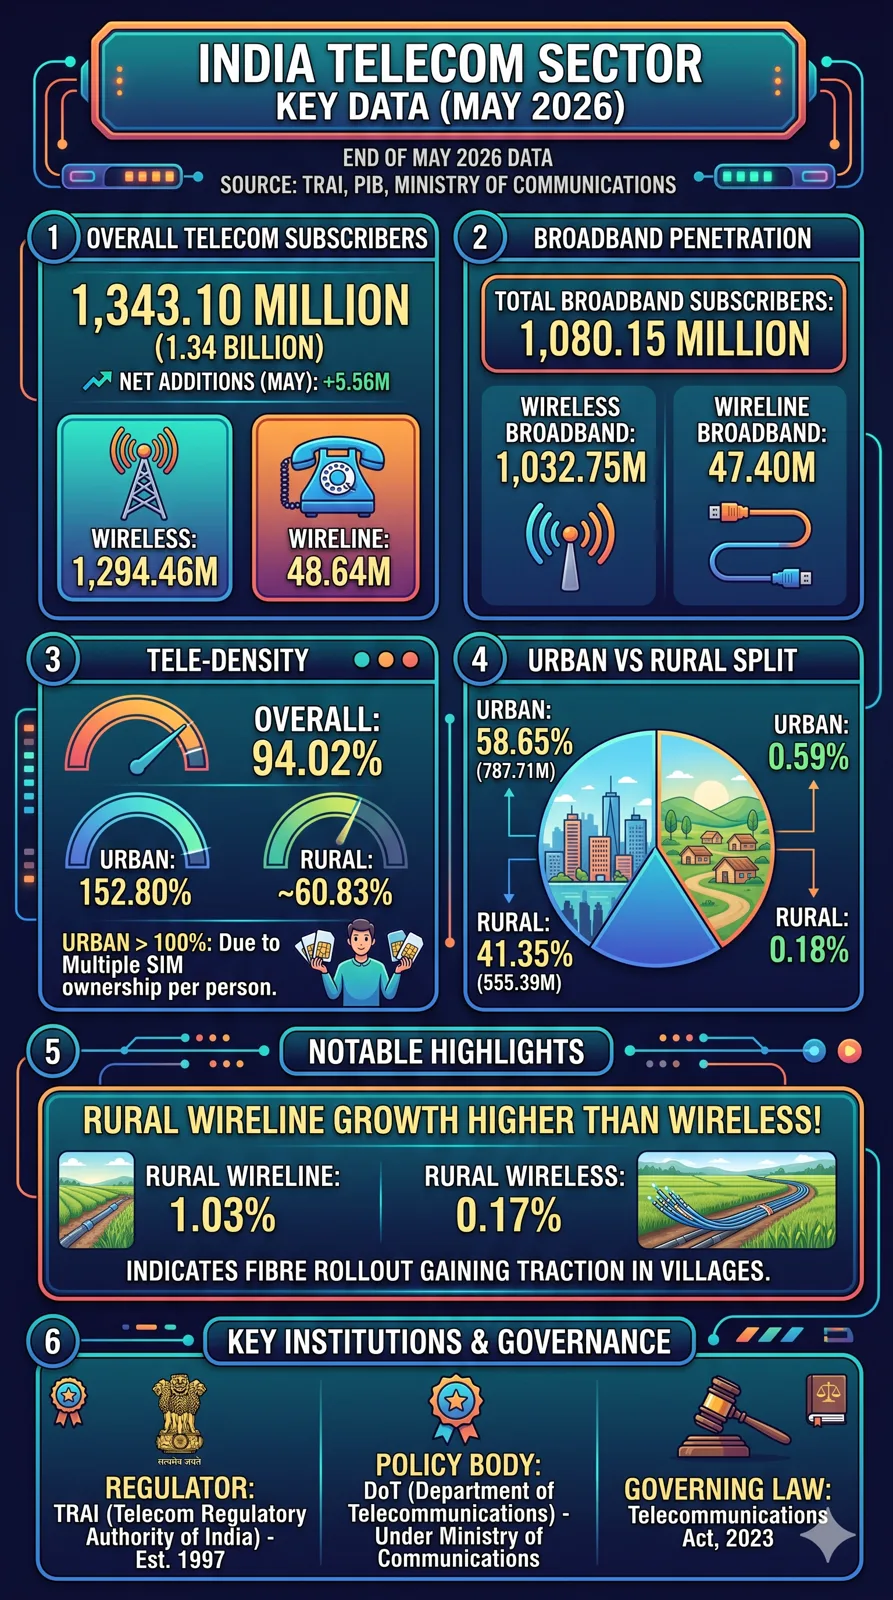
- Scale: India's total telephone subscriber base stood at 1343.10 million (1.34 billion) as of May 2026 — one of the world's largest telecom markets. [1]
- Dual significance: Tracks both connectivity equity (rural vs. urban) and economic enablement (broadband as digital infrastructure). [1]
2. Why in the News
- PIB released the Highlights of Telecom Subscription Data at the end of May 2026 on 25 June 2026, showing continued subscriber growth with 5.56 million net additions in a single month. [1]
- The data is significant as India's total broadband base crossed 1,080 million, underscoring the success of Digital India's connectivity push. [1]
- Trend context: April 2026 data had shown wireless subscriber base at 1,288.96 million and broadband at 1,073.44 million, with May 2026 recording further acceleration in rural wireless additions. [2]
3. Background & Evolution
- TRAI established: 1997 under the Telecom Regulatory Authority of India Act, 1997 to regulate telecom services and protect consumer interests.
- Monthly data releases: TRAI mandates all licensed operators to submit subscriber data monthly; PIB disseminates highlights.
- Key milestones:
- 2000s: Wireless revolution — mobile subscriber base overtook wireline.
- 2016: Reliance Jio launch → disruptive tariff reduction → massive broadband growth.
- 2020–21: COVID-19 accelerated digital adoption; broadband subs surged.
- 2022–2023: 5G spectrum auctions; 5G rollout began in Oct 2022.
- 2023: New Telecommunications Act, 2023 replaced the Indian Telegraph Act, 1885 — modernised legal framework.
-
2024–2026: Continued 5G expansion; Fixed Wireless Access (FWA) growth boosting wireline-equivalent broadband; rural broadband push via BharatNet.
-
Predecessors: Department of Telecommunications (DoT) subscriber reports pre-TRAI; earlier data under Posts and Telegraphs Department.
4. Core Static Facts
Key Data — End of May 2026 [1]
| Particulars | Wireless | Wireline | Total |
|---|---|---|---|
| Total Subscribers (Million) | 1294.46 | 48.64 | 1343.10 |
| Net Addition May 2026 (Million) | 5.50 | 0.06 | 5.56 |
| Monthly Growth Rate | 0.43% | 0.12% | 0.42% |
| Urban Subscribers (Million) | 744.36 | 43.35 | 787.71 |
| Urban Net Addition (Million) | 4.58 | 0.01 | 4.59 |
| Urban Monthly Growth Rate | 0.62% | 0.01% | 0.59% |
| Rural Subscribers (Million) | 550.11 | 5.28 | 555.39 |
| Rural Net Addition (Million) | 0.92 | 0.05 | 0.98 |
| Rural Monthly Growth Rate | 0.17% | 1.03% | 0.18% |
| Broadband Subscribers (Million) | 1032.75 | 47.40 | 1080.15 |
Tele-Density (May 2026) [1]
| Level | Wireless | Wireline | Total |
|---|---|---|---|
| Overall | 90.61% | 3.40% | 94.02% |
| Urban | 144.39% | 8.41% | 152.80% |
| Rural | 60.25% | 0.58% | ~60.83% |
Urban-Rural Share [1]
| Wireless | Wireline | Total | |
|---|---|---|---|
| Urban share | 57.50% | 89.13% | 58.65% |
| Rural share | 42.50% | 10.87% | 41.35% |
Institutional Framework
- Releasing Ministry: Ministry of Communications (Department of Telecommunications — DoT)
- Regulatory Body: Telecom Regulatory Authority of India (TRAI)
- Enabling Legislation: TRAI Act, 1997; Telecommunications Act, 2023
- Data frequency: Monthly
- Operators reporting (April 2026 reference): 1,538 operators [2]
5. Multi-Dimensional Analysis
Economic
- India's telecom sector contributes ~6% of GDP; subscriber growth signals sustained digital economy expansion. [1]
- Broadband base of 1,080 million enables e-commerce, fintech, gig economy — direct multiplier on productivity.
- Monthly net additions of 5.56 million reflect market confidence and affordability of services post-Jio tariff war.
- Wireline growth (0.12% monthly) driven by Fixed Wireless Access (FWA) offerings from Jio and Airtel, creating new broadband revenue streams. [2]
Social
- Rural tele-density at ~60.83% vs. urban 152.80% — stark connectivity gap; rural subscribers are 41.35% of total but represent 68%+ of India's population. [1]
- Urban monthly growth (0.59%) nearly 3.3× rural growth (0.18%) — digital divide persists despite BharatNet and USO Fund interventions. [1]
- Wireline rural growth rate (1.03% monthly) exceeds wireless rural (0.17%) — suggests fibre rollout to rural areas gaining traction. [1]
- Broadband penetration is a proxy for access to e-governance, telemedicine, and online education — equity dimension critical for tribal and remote communities.
Scientific / Technological
- Wireless broadband (1,032.75 million) dwarfs wireline broadband (47.40 million), reflecting India's "mobile-first" internet model. [1]
- 5G rollout (ongoing since Oct 2022) is the underlying tech driver for both speed upgrades and FWA-based wireline substitution.
- Urban tele-density >100% (152.80%) indicates multiple SIM ownership — common in India; not real person-to-person ratio.
- M2M (Machine-to-Machine) cellular connections are included in overall tele-density calculation (94.02% with M2M). [1]
Administrative / Governance
- Data covers licensed service areas (LSAs) — DoT's administrative geography for telecom regulation.
- Universal Service Obligation (USO) Fund — levied at 5% of Adjusted Gross Revenue (AGR) — finances rural connectivity; rural growth figures reflect USO Fund effectiveness.
- BharatNet (Phase I, II, III) targets gram panchayat-level optical fibre — directly linked to rural wireline and broadband growth trends.
- TRAI's monthly reporting mechanism ensures regulatory transparency and enables course-correction in spectrum/licensing policy.
Legal / Constitutional
- TRAI Act, 1997: Established TRAI as independent regulator; amended 2000 to create TDSAT (Telecom Disputes Settlement and Appellate Tribunal).
- Telecommunications Act, 2023: Replaced Indian Telegraph Act, 1885 and Indian Wireless Telegraphy Act, 1933; modernised spectrum management, Right of Way provisions.
- Article 19(1)(a) implications: Supreme Court has recognised internet access as linked to freedom of expression — regulatory subscriber data informs any internet shutdown jurisprudence.
Ethical / Governance
- Subscriber data excludes quality metrics (speed, latency) — tele-density does not equal meaningful connectivity.
- Multiple SIM cards inflate wireless subscriber numbers; active user count would be substantially lower — a governance transparency concern.
- Rural wireline share (10.87% of wireline total) vs. rural population share (~68%) reveals deep infrastructure equity deficit.
6. Recent Developments (Last 12–18 Months)
- Oct–Dec 2024: 5G subscriber base crossed 100 million in India; Jio and Airtel leading 5G additions.
- Jan 2026: Total telephone subscribers at ~1,323 million (per PIB Jan 2026 data); broadband at ~1,037 million. [3]
- Feb 2026: PIB released February 2026 data; steady monthly additions recorded. [4]
- Mar 2026: Total broadband subscribers at 1,065.88 million; wireless tele-density at 89.88%. [2]
- Apr 2026: Broadband subscribers rose to 1,073.44 million (monthly growth 0.71%); wireless tele-density 90.28%; wireline at 48.58 million. [2]
- May 2026 (current): Total subscribers 1,343.10 million; broadband 1,080.15 million; wireless tele-density 90.61%; overall tele-density 94.02%; net additions 5.56 million. [1]
- June 2026: Telecommunications Act, 2023 implementation continues; DoT progressing on spectrum assignment for satellite broadband (OneWeb, Starlink).
7. Prelims Hooks (High-Density Factual Bullets)
- Total telephone subscribers in India at end of May 2026: 1,343.10 million. [1]
- Total broadband subscribers at end of May 2026: 1,080.15 million. [1]
- Wireless broadband subscribers: 1,032.75 million; Wireline broadband: 47.40 million. [1]
- Net subscriber additions in May 2026: 5.56 million (wireless: 5.50M + wireline: 0.06M). [1]
- Overall tele-density (with M2M) at end of May 2026: 94.02%. [1]
- Urban tele-density: 152.80% — exceeds 100% due to multiple SIM ownership. [1]
- Rural tele-density (wireless): 60.25%. [1]
- Urban subscribers constitute 58.65% of total; rural subscribers 41.35%. [1]
- Wireline subscribers: 48.64 million; wireline urban share: 89.13% of all wireline. [1]
- Rural wireline monthly growth rate (1.03%) exceeded rural wireless monthly growth rate (0.17%) in May 2026. [1]
- Telecom subscription data is compiled by TRAI and released by the Ministry of Communications via PIB. [1]
- TRAI was established under the TRAI Act, 1997; telecom sector modernised by the Telecommunications Act, 2023 (replaced Indian Telegraph Act, 1885). [2]
- As of April 2026, 1,538 operators reported data to TRAI for broadband subscriber counts. [2]
- India's wireless subscriber base (May 2026): 1,294.46 million (wireless-only). [1]
- Urban wireless monthly growth (0.62%) was higher than rural wireless growth (0.17%) in May 2026 — digital divide persists. [1]
8. Mains Relevance
GS Paper Mapping:
- GS-III: Infrastructure — Telecom, Digital India, Broadband connectivity, BharatNet
- GS-II: Government Policies — TRAI, regulatory frameworks, e-governance
Specific Syllabus Headings:
- GS-III: "Infrastructure: Energy, Ports, Roads, Airports, Railways etc." → by extension, digital/telecom infrastructure
- GS-II: "Government policies and interventions for development in various sectors and issues arising out of their design and implementation"
- GS-III: "Science and Technology — developments and their applications and effects in everyday life"
Plausible Mains Question Stems:
-
"Despite India having over 1.34 billion telephone subscribers and a tele-density of 94%, the rural digital divide remains acute. Analyse the structural and policy reasons for this gap and suggest measures to bridge it." (GS-III / GS-II, 15 marks)
-
"Critically examine the role of TRAI in shaping India's telecom sector since 1997. How does the Telecommunications Act, 2023 alter the regulatory landscape?" (GS-II, 15 marks)
9. Related Topics to Study Next
| Topic | Connection |
|---|---|
| BharatNet Project | Direct enabler of rural broadband growth visible in wireline rural addition data |
| Telecommunications Act, 2023 | New legal framework replacing 1885 Act — governs entire subscription/licensing regime |
| Digital India Programme | Umbrella policy under which telecom expansion is a core pillar |
| Universal Service Obligation (USO) Fund | Finances rural telecom infra; explains rural tele-density improvement trends |
| 5G Spectrum Auctions (2022, 2024) | Technology backbone behind wireless broadband growth surge |
| TRAI — Structure, Powers, TDSAT | Regulatory body compiling this data; frequently asked in GS-II |
| National Broadband Mission (2019) | Target of 50 Mbps to every citizen; tracks against broadband sub data |
| PM-WANI (Wi-Fi Access Network Interface) | Public Wi-Fi scheme to extend last-mile broadband — complements subscriber data |
10. Common Errors / Trap Areas
-
Tele-density ≠ % of population with phones: Urban tele-density of 152.80% does not mean 152% of people have phones — it includes multiple SIMs per person and M2M connections. Tele-density = (subscribers / population) × 100.
-
TRAI vs. DoT confusion: TRAI is the regulator that compiles and analyses data; DoT (Department of Telecommunications) under Ministry of Communications is the policy/licensing body. The PIB release is from Ministry of Communications, not TRAI directly.
-
Broadband definition: TRAI defines broadband as connections with download speed of 512 Kbps or above (revised periodically) — do not confuse with global standards. All 1,080 million "broadband" subscribers include mobile data users meeting this threshold.
-
Wireline ≠ only landlines: Wireline broadband (47.40 million) includes Fibre-to-the-Home (FTTH) and Fixed Wireless Access (FWA) in some classifications — not just copper PSTN lines.
-
Rural growth rate vs. absolute numbers: Rural wireline monthly growth rate (1.03%) is higher than urban wireline (0.01%), but the absolute rural wireline base (5.28 million) is tiny compared to urban (43.35 million) — aspirants confuse rate with volume, leading to incorrect inferences about rural connectivity progress.
Sources
- 1Highlights of Telecom Subscription Data at the end of May 2026pib.gov.in · tier 1
- 2Highlights of Telecom Subscription Data at the end of April 2026pib.gov.in · tier 1
- 3Highlights of Telecom Subscription Data as on 31st January 2026pib.gov.in · tier 1
- 4Highlights of Telecom Subscription Data at the end of February 2026pib.gov.in · tier 1
- 5TRAI Telecom Subscriptions Reports (portal)trai.gov.in · tier 1
- 6TRAI Press Release No. 53/2026 — Telecom Subscription Data March 2026trai.gov.in · tier 1